 |
 |
 |
 |
 |
 |
 |
 |
 |
 |
 |
 |
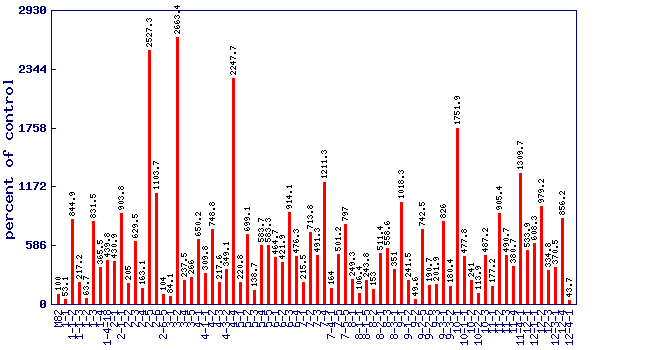
| Relative 3-methyl-1-butanol level (percent of control)* Experiment: flavor related metabolite profiling in S. pennellii IL lines (FL, Spring 2003, Field) |
 |
| line | relative level (percent of control) |
|---|---|
| M82 | 100 |
| 1-1 | 53.1 |
| 1-1-2 | 844.9 |
| 1-1-3 | 217.2 |
| 1-2 | 63.7 |
| 1-3 | 831.5 |
| 1-4 | 365.5 |
| 1-4-18 | 439.8 |
| 2-1 | 430.9 |
| 2-1-1 | 903.8 |
| 2-2 | 205 |
| 2-3 | 629.5 |
| 2-4 | 163.1 |
| 2-5 | 2527.3 |
| 2-6 | 1103.7 |
| 2-6-5 | 104 |
| 3-1 | 84.1 |
| 3-2 | 2663.4 |
| 3-4 | 237.5 |
| 3-5 | 266 |
| 4-1 | 650.2 |
| 4-1-1 | 309.8 |
| 4-2 | 748.8 |
| 4-3 | 217.6 |
| 4-3-2 | 349.1 |
| 4-4 | 2247.7 |
| 5-1 | 220.8 |
| 5-2 | 699.1 |
| 5-3 | 138.7 |
| 5-4 | 583.7 |
| 5-5 | 583.3 |
| 6-1 | 464.7 |
| 6-2 | 421.9 |
| 6-3 | 914.1 |
| 6-4 | 476.3 |
| 7-1 | 215.5 |
| 7-2 | 713.8 |
| 7-3 | 491.3 |
| 7-4 | 1211.3 |
| 7-4-1 | 164 |
| 7-5 | 501.2 |
| 7-5-5 | 797 |
| 8-1 | 249.3 |
| 8-1-1 | 106.4 |
| 8-1-5 | 243.8 |
| 8-2 | 153 |
| 8-2-1 | 511.4 |
| 8-3 | 558.6 |
| 8-3-1 | 351 |
| 9-1 | 1018.3 |
| 9-1-2 | 241.5 |
| 9-2 | 49.6 |
| 9-2-5 | 742.5 |
| 9-2-6 | 190.7 |
| 9-3 | 201.9 |
| 9-3-1 | 826 |
| 9-3-2 | 180.4 |
| 10-1 | 1751.9 |
| 10-1-1 | 477.8 |
| 10-2 | 241 |
| 10-2-2 | 113.9 |
| 10-3 | 487.2 |
| 11-1 | 177.2 |
| 11-2 | 905.4 |
| 11-3 | 490.7 |
| 11-4 | 380.7 |
| 11-4-1 | 1309.7 |
| 12-1 | 533.9 |
| 12-1-1 | 608.3 |
| 12-2 | 979.2 |
| 12-3 | 334.8 |
| 12-3-1 | 370.5 |
| 12-4 | 856.2 |
| 12-4-1 | 43.7 |
* Note
|